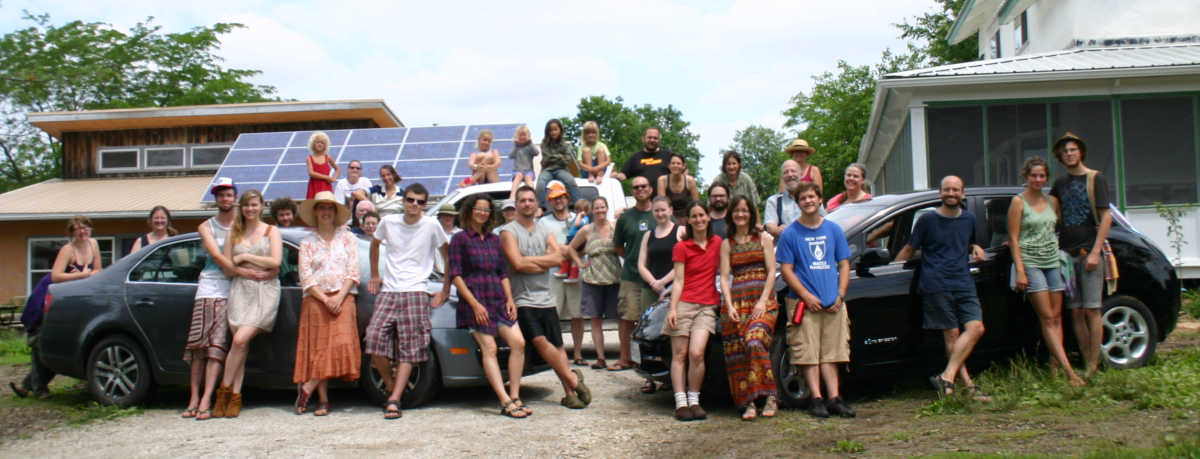
How Dancing Rabbit Ecovillage’s footprint compares to America’s footprint
At Dancing Rabbit we’ve designed our village entirely around principles of sustainability, and tried to create a culture that makes ecological living the norm rather than the exception.
But how are we doing at reducing our carbon footprint, one of the key metrics for sustainability?
Scientists say that the US needs to reach a per capita carbon footprint of 9 metric tons of CO2 equivalent (mtCO2eq) per year by 2030, and a further reduction to 4 mtCO2eq per year by 2050[1]; yet Americans are currently consuming an untenable 20 metric tons of CO2eq per year.
Some wonder if it is even possible to reach that goal. At Dancing Rabbit, we are trying to prove that it can be done, by reaching those 2030 goals now and continuing to push towards those 2050 goals every year.[2]

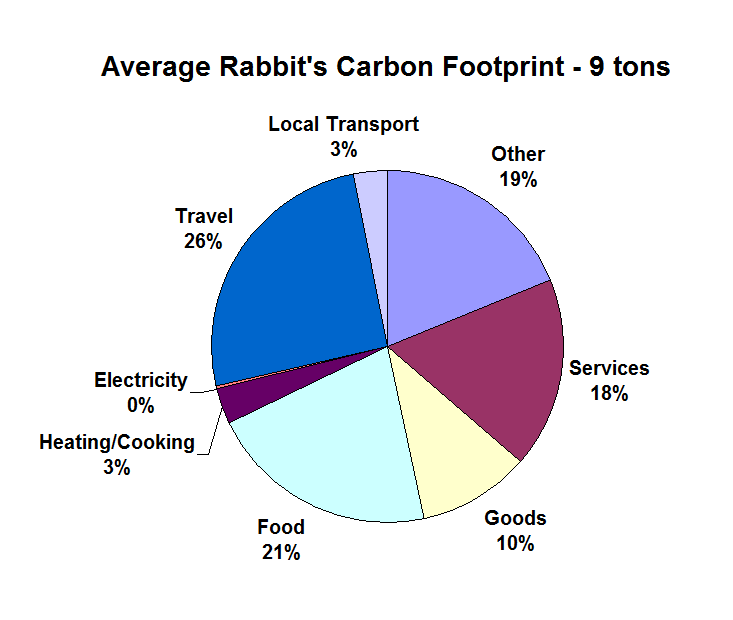
Breaking Down Our Carbon Footprint
So where does that 20 tons come from?
You can slice and dice it a bunch of different ways, but looking at it from the personal point of view it comes down to a few big areas: local transport, travel, home energy use (electricity and gas), food, and goods and services. These add up to most of your footprint, with some amount coming from your share of government and other sources.
Let’s look at each of those main areas and see how the average Dancing Rabbit denizen stacks up against the average American.
Local Transportation
The average American emits 2.9 metric tons of CO2eq each year, getting around town, with 99% coming from driving cars and only 1% from public transit.[3]
At Dancing Rabbit we’ve cut our emissions for local transportation by 89%, to only 0.3 metric tons of CO2eq.
How?
4 vehicles for 70 people
Primarily by working from home and driving less. The average Rabbit drives just 911 miles per year locally through our car co-op, compared to 6500 for the average American. By sharing cars and sharing trips we minimize our miles.
We also cut our emissions per mile by 30% by using fuel efficient vehicles and running them on biodiesel and solar electricity.
Travel
The average American emits another 2.9 metric tons of CO2eq each year on long distance travel.[4] About 45% of that comes from long distance car trips[5] and 55% from air travel (this includes a radiative forcing factor for air travel’s high altitude emissions).[6]
Unfortunately the average Rabbit emits only 10% less from travel than the average American, which ends up being a huge factor in the average Rabbit footprint (or should I say pawprint?). We actually end up traveling more miles per person than the average American, but because we do much of it by train instead of car or plane, our emissions end up a little lower.
It seems that our remote location, far from family and friends, means a lot of travel. We also have more flexible schedules which improves quality of life but also seems to allow for more travel and thus emissions.
Home Energy Use – Electricity
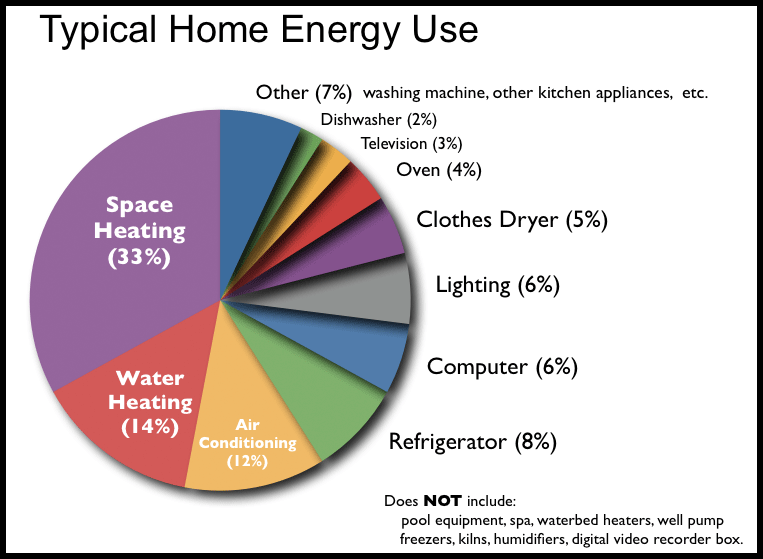
Courtesy of home-wizard.com
The average American home uses 10,836 kilowatt-hours of electricity each year,[7] which creates emissions of 2.9 metric tons of CO2eq. The main uses are space heating (33%), water heating (14%), air conditioning (12%), lighting (6%), refrigeration (8%), computers (6%), and clothes drying (5%).
At Dancing Rabbit we’ve cut our electricity use by more than 80% in our homes, primarily through efficiency, conservation and finding alternatives. On the whole, we use less air conditioning, don’t have many televisions, choose mostly CFLs or LEDs for lighting, and use less refrigerator space per person by sharing or choosing smaller fridges. We heat our water with the sun and firewood, and we dry our clothes on clotheslines. We also tend to choose the most efficient appliances, including laptop computers, and make sure things are turned all the way off when not in use. We’ve designed and built our homes to be well insulated with passive solar design and good natural ventilation and daylighting, which reduces the energy used for heating, cooling, and lighting.
Once we’ve reduced our use, we then provide for our electricity with solar and wind power, and are now a net exporter of renewable energy. This has allowed us to bring our electricity footprint down to almost zero (0.02 metric tons of CO2eq), even when the energy used to create our solar and wind systems is taken into account.
Home Energy Use – Natural Gas, Propane, and Firewood
The average American spends 43% of their home energy use heating their home and 18% on heating water.[8] Most of this is done with natural gas, which when you add in cooking and clothes drying, leads to emissions of 2.2 metric tons of CO2eq.[9]
At DR we use firewood for home and water heating, which is a locally renewable resource (we mostly use waste wood from local industry) and has a very low greenhouse gas emissions profile.[10] Unfortunately burning wood creates big problems with air quality, and would really be unsuitable for most people in urban areas.
The real key is to build our homes to be more efficient in the first place. This winter we measured all the firewood used in one of our strawbale homes and found that we were using about half the energy per square foot of the typical home in the US. Fifty percent is pretty good, but these days eco builders are aiming at standards such as Passive House, which, through super insulation and air tightness, gives an 80% reduction in home energy use compared to current codes.
Something like Passive House is the direction we need to be headed in, so it’s important for us to support green building and stricter energy codes.
At DR, one of the few things we do allow fossil fuels for is cooking, though many of us use firewood and renewable electricity. We do a lot to conserve energy while cooking by using hay boxes, pressure cookers, and solar cookers.
In the end, our emissions from home heating, water heating, and cooking come out to 0.35 metric tons of CO2eq, or about 85% less than the average American.
Food
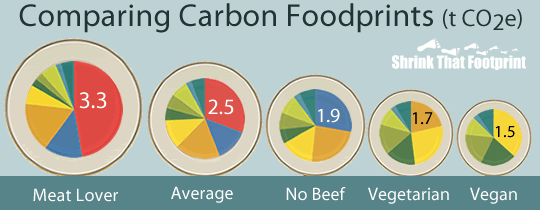
Courtesy of ShrinkThatFootprint.com
By some measures our food systems account for almost 25% of Americans’ carbon emissions,[11] including agriculture, farming based deforestation, food processing, and transport. And while food impact is more difficult to measure than electricity or gas use, food choices can make a big difference.
One big factor is how much meat you eat. You can cut your footprint by 30% with a vegetarian diet and 40% with a vegan diet.[12] But you don’t have to be a purist to get those savings — any reduction in meat, especially red meat, will reduce your carbon footprint.
Another big factor is food waste. American families throw out approximately 25% of the food and beverages they buy, and when you include other losses in our food system the total is 40%.[13]
Buying local can also cut your food impact, but not by as much as you might think. Food transport only accounts for 11% of emissions from food. As one study said, “dietary shift can be a more effective means of lowering an average household’s food-related climate footprint than ‘buying local.'”[14] Of course buying local also supports your local community and economy, and can shift how food is grown (often to smaller scale) and how much is wasted, so it’s not just about the transportation costs.
There are various figures out there for the average American food footprint depending on how it is calculated, but 3 metric tons of CO2eq[15] seems like a reasonable figure.
Dancing Rabbit does not have good data on our diets or food sources yet, but we have potentially lowered our footprint by 30-50% based on our less meat-based diet of local, organic, less-processed food with less waste. We grow a lot of vegetables, fruit, and some animal products within the community or get them from our neighbors. We buy some food at local grocery stores but buy most of our food in bulk directly from a natural foods distributor, which reduces the impact from packaging and the grocery stores themselves.
Goods and Services and Waste
A significant part of the emissions related to our lives happen not in our homes but in businesses and commercial facilities around the country and the world. But these businesses do not operate just for fun! They are there to provide goods and services that people consume (and to make a profit generally). So, at some level the bottom line responsibility for their emissions rests on individuals and the purchasing choices we make.
For goods such as appliances, furniture, clothing, electronics, toys, paper, office supplies, and medical supplies, the average American has a footprint of 2.3 metric tons of CO2eq per year.
We don’t have clear figures on how many “goods” the average Rabbit consumes, but we do have good data on how much trash and recycling we create. Last summer researchers from University of North Texas did an analysis of DR’s impact (the source for much of the data on DR in this article) and as part of that they weighed all trash and recycling at DR for two months[16 ].
Their tally showed that Rabbits produced 2 lbs of waste per person per day, or about 55% less than the average American. While the average American recycles only 34% of their waste, the average Rabbit recycles almost 80% of their waste, leaving only 0.4 lbs/day going to the landfill, for a net reduction of 85% in landfilled waste. We’re still dismayed at how much stuff ends up in our dumpster each week and would love to do better, but it will likely mean reducing trash at the source rather than better recycling.
Interestingly, both the average American and the average Rabbit save about 0.6 metric tons of CO2eq each year by recycling about 600 lbs of waste.[17] That’s the same emissions as a 500 mile round trip flight, so it’s certainly nothing to sneeze at.
But the real savings comes from reducing consumption in the first place. Since municipal waste generation has generally paralleled household consumption[18] it is reasonable to assume that the average Rabbit produces half the waste of an average American, since we consume about half of the goods. So we can estimate a Rabbit footprint of 1 metric ton of CO2eq for goods, minus the 0.6 metric tons from recycling, for a net of 0.4 metric tons. Its possible, that our impact is lower due to a high proportion of goods we purchase being used and second hand.
Approximately 2.5 tons of CO2eq comes from the services that Americans consume such as healthcare (38%), education (16%), entertainment (14%), telecommunications (5%), and other businesses, from hair salons to tax preparers.[19]
At DR we consume some of the same services at similar levels to most Americans, like healthcare, education, and telecommunications, but we use far less of many other services since we do so much more directly for ourselves. We do not currently have good data on our emissions from services, but it is reasonable to assume it tracks similarly with our reduction in consumption of goods, so a 30-50% reduction could apply.
Conclusion
So how does it all add up?
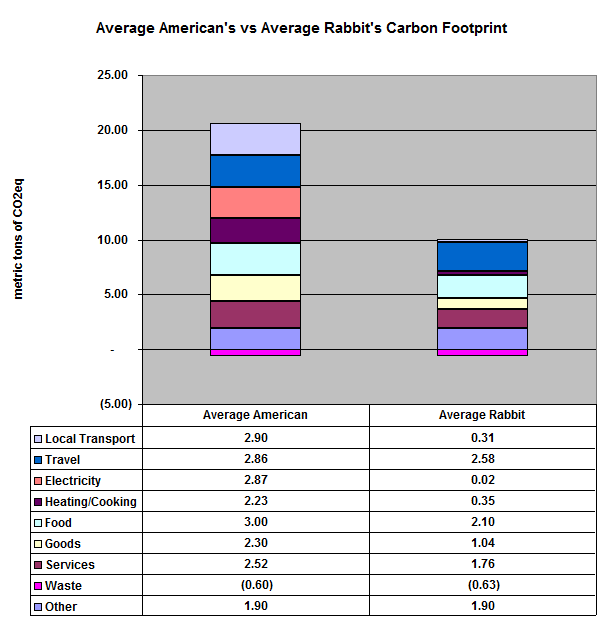
Given our calculations and the estimates above the average Rabbit has a carbon footprint of 8.3 to 9.4 metric tons of CO2eq each year. That’s a 53% reduction compared to the average American, and at a level that meets emission reduction targets for 2030.
And while we have come a long way, we still have a long way to go to reach a long term sustainable carbon footprint, especially in the areas of travel, food, and goods and services.
Food is something we are actively working on as each year; by continuing to increase our onsite and local food production capacity, we hope to continue to lower our food impact (though it will continue to be difficult to measure accurately).
We look forward to a time when all goods and services are produced with lower carbon footprints, but until then, we can continue to lower our footprint by sharing, reducing, reusing, repairing, recycling, and doing more for ourselves.
And travel is by far the most challenging. We could cut our impact in half if all our trips were taken by train or bus, or even in cars that were full. But there is really no viable option we are aware of for low-carbon travel at speeds similar to airplanes.
Another option for Dancing Rabbit is to continue to manage our land to sequester more and more carbon. The calculations above do not account for any carbon stored on our land due to tree planting, prairie restoration, and building soil in our gardens and agricultural fields. Since most people don’t have 280 acres to manage for sequestration this isn’t an option for everyone, but through careful management we may be able to further sequester carbon on our land and balance out some of the emissions from our village.
We might also choose to offset our emissions by exporting additional renewable energy into the national grid, thus reducing others’ emissions. This would work well in the short term, but as our nation ‘decarbonizes’ our grid electricity (which we hope it will soon), we will have to find other ways to further reduce or offset our emissions.
So while there is still work to do, we’re showing that we can lower our impact — we can do what it takes to prevent catastrophic climate change and still lead healthy and happy lives.
And we know that you can do it too.
Footnotes
[2] Unless otherwise noted, all data for Dancing Rabbit emissions is based on research done in 2013 by Brooke Jones with support from the University of North Texas and Arkansas Tech University.
[3] Calculations from various sources:
https://www.fhwa.dot.gov/policyinformation/pubs/hf/pl11028/chapter4.cfm
https://www.rita.dot.gov/bts/sites/rita.dot.gov.bts/files/publications/national_transportation_statistics/html/table_01_40.html
https://cta.ornl.gov/data/tedb32/Edition32_Chapter08.pdf,https://www.census.gov/popest/data/historical/2010s/vintage_2011/index.html
https://www.buses.org/files/ComparativeEnergy.pdf
[4] https://en.wikipedia.org/wiki/Environmental_impact_of_transport
https://www.rita.dot.gov/bts/sites/rita.dot.gov.bts/files/publications/national_transportation_statistics/html/table_01_40.html
[6] https://www.carbonfund.org/how-we-calculate. For information on the radiative forcing factor for aviation see: https://www.ipcc.ch/publications_and_data/ar4/wg3/en/ch5s5-3-3.html
[11] https://www.annualreviews.org/eprint/EBIXxM7sNxrBJyuRYgki/full/10.1146/annurev-environ-020411-130608
[15] https://www.deq.state.or.us/programs/docs/Jones_Kammen_SOM_Quantifying_Carbon_Footprint3-21-11.pdf (divided by 2.5 persons per household)